Back to projects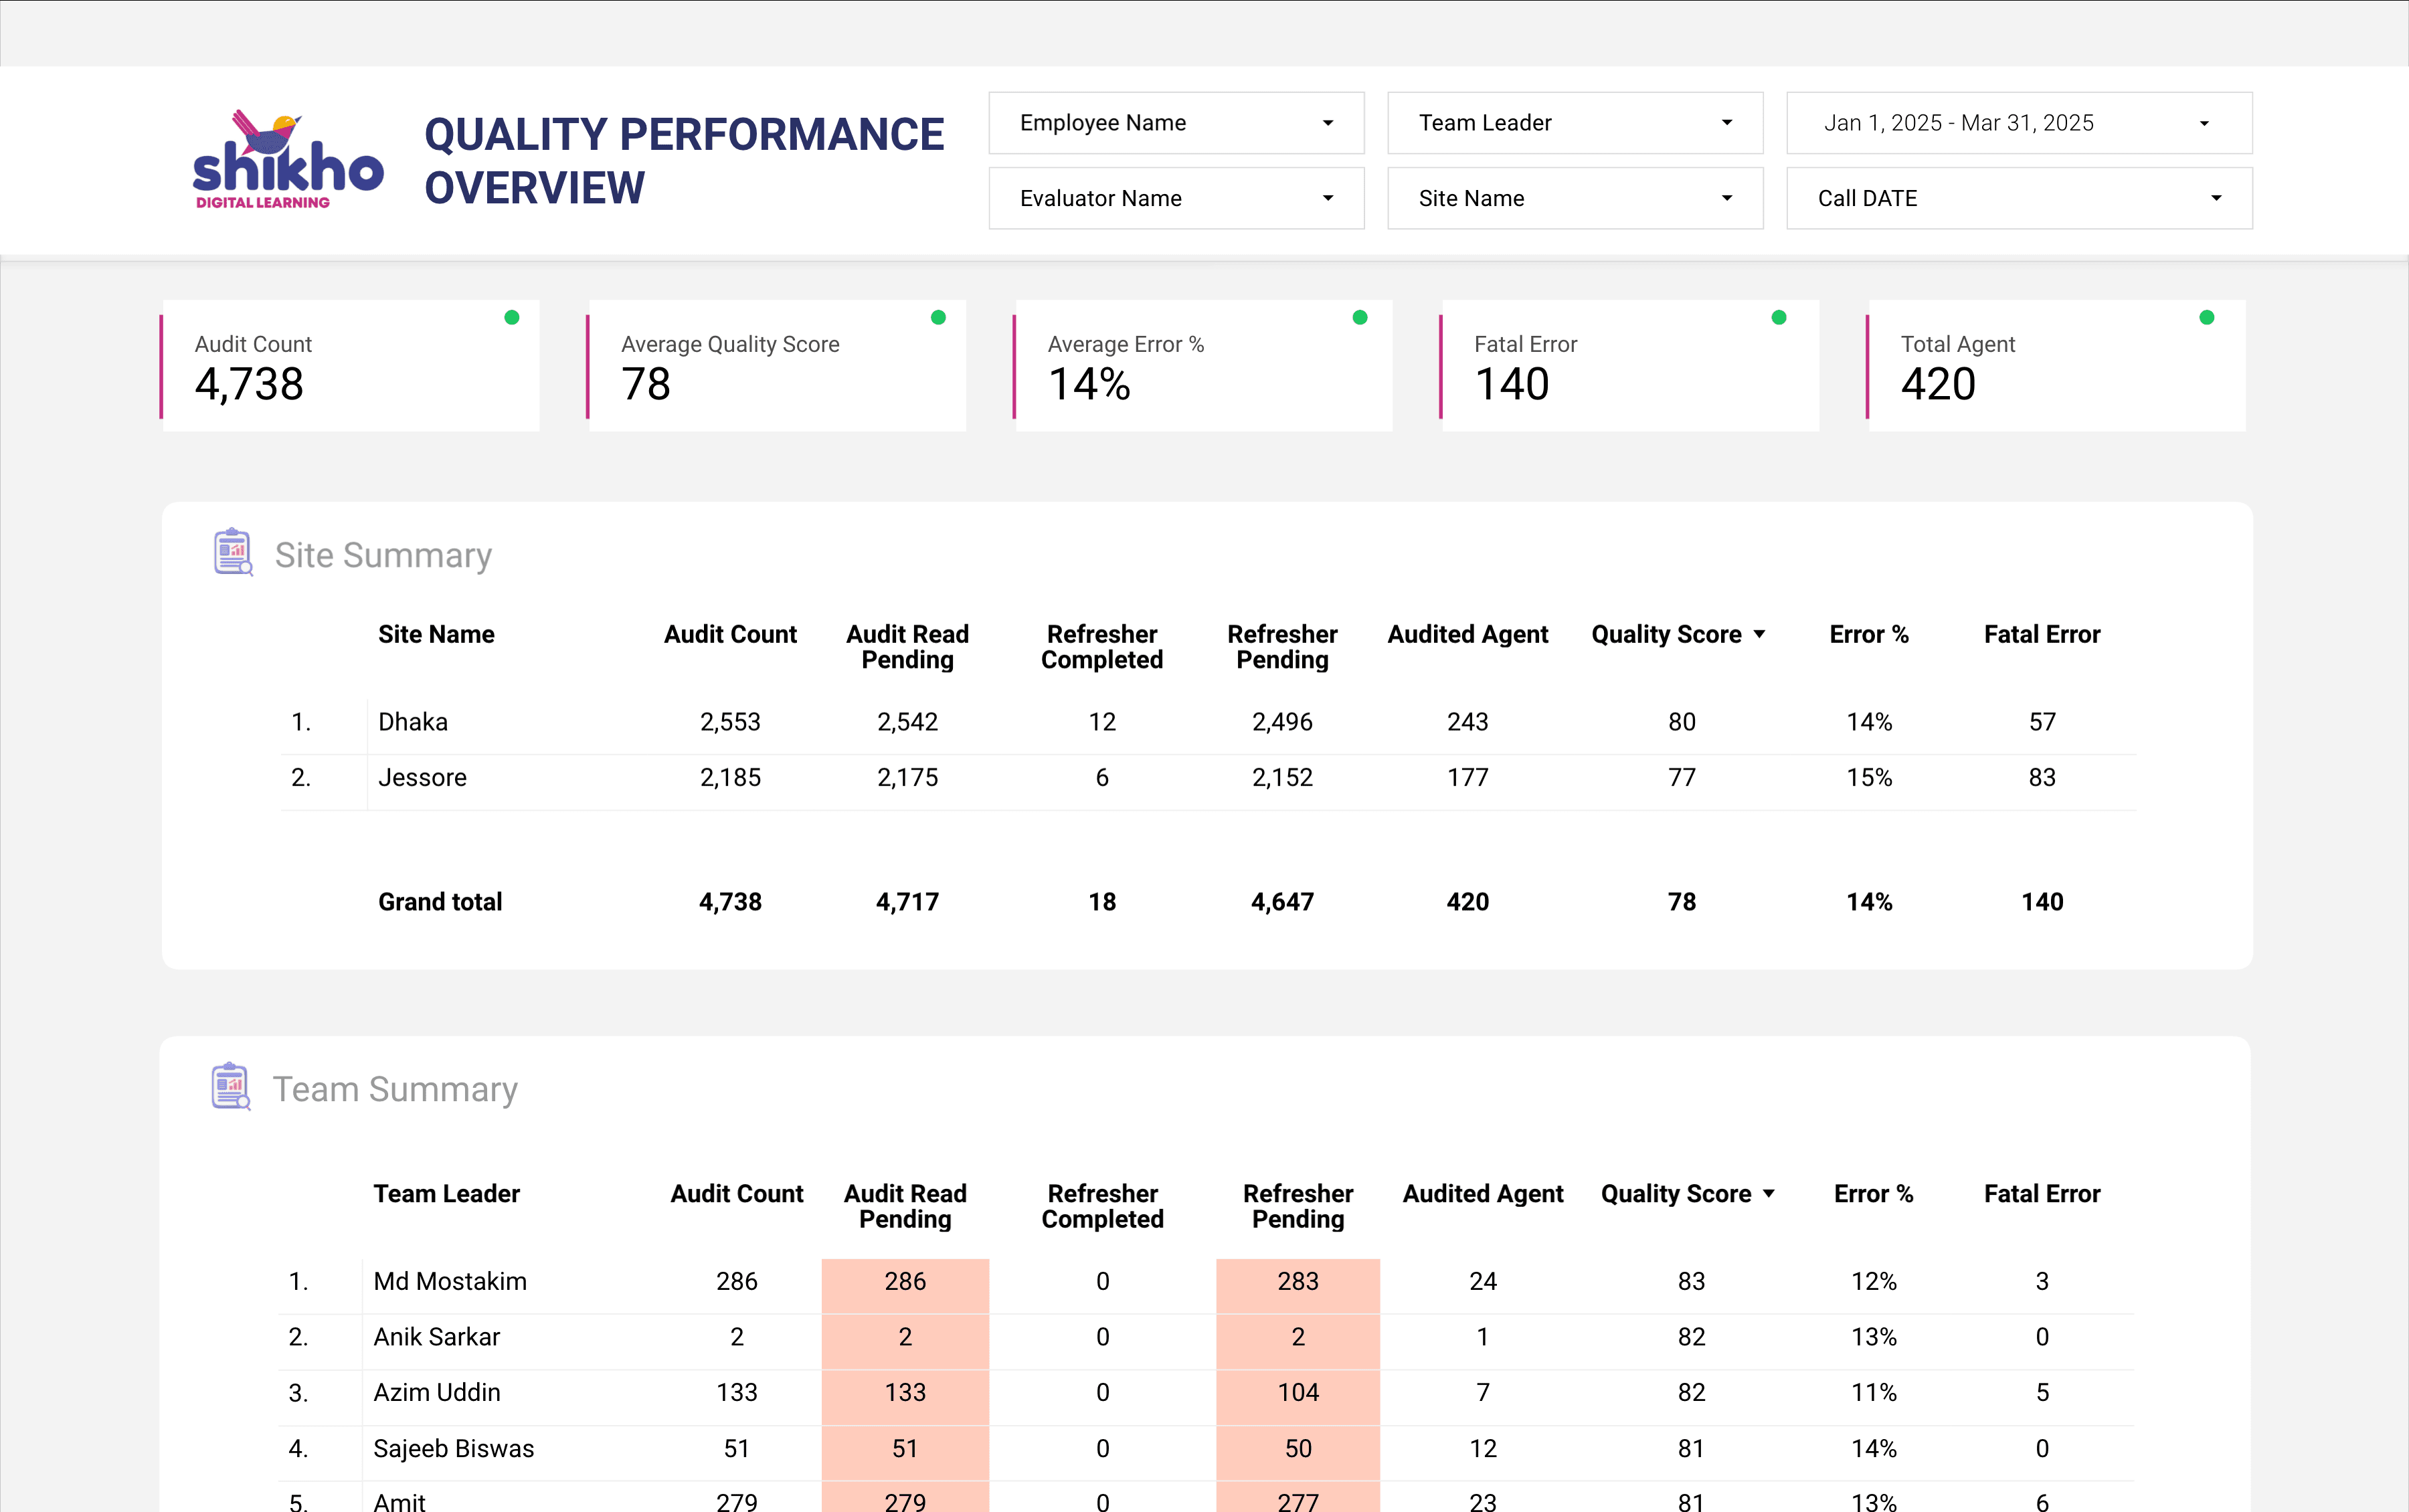
Looker Studio
Analytics Dashboards
Interactive data visualization dashboards built with Looker Studio for business intelligence and reporting.
Click to view all 5 screens
The Challenge
Teams were spending hours every week manually compiling reports from spreadsheets, with outdated data and no way to drill down into metrics.
The Solution
- Designed interactive dashboards with drill-down capabilities
- Connected multiple data sources for unified reporting
- Built date range filters and dynamic segments for flexible analysis
- Created scheduled email reports for stakeholders
- Implemented KPI scorecards with trend indicators
Tech Stack
Looker StudioGoogle SheetsBigQueryData Blending
Results
Real-time insights that replaced 4+ hours of weekly reporting
Screenshots
Click to expand
1 / 5
Need something similar?
Let's discuss how I can help automate your workflows.
